For over 100 years, the U.S. Department of Labor has been tracking economic trends and changes in pricing within the United States. Wondering how much a gallon of milk cost in 1913? The Consumer Price Index (CPI) can tell you that. The CPI, a project of the U.S. Bureau of Labor Statistics, reports changes in the price of goods and services over time. By studying this data, you can learn the spending habits of those in the past, and perhaps make informed decisions about future spending habits of your own.
Because of its focus on pricing data, the CPI has become the leading source for information on inflation in the U.S. economy. Inflation, an overall increase in the price of goods and services over time, is important to both the general public and U.S. legislators, as policies are often enacted around the rate of inflation. By tracking this data, we can see major trends throughout the years and evaluate how everyday Americans, as well as our leaders, have responded to changing prices. Historical inflation data gives us a window into what life might have been like for past Americans.

One component that is particularly relatable, no matter the year, is the price of food. Over the last 100 years, the period that saw the highest increase in food prices was 1941-1951, with an overall annualized increase of 8.0%. This can be attributed to the rise in prices at the onset and conclusion of World War II, as the country was emerging from the Great Depression. Conversely, the period that saw the sharpest decrease in food prices was 1927-1941, with prices dropping 1.9%. The largest annualized decrease occurred during the beginning of the Great Depression from December 1929 to June 1933 when food prices dropped 13%.
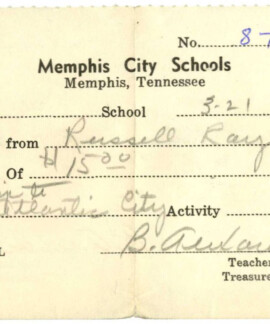
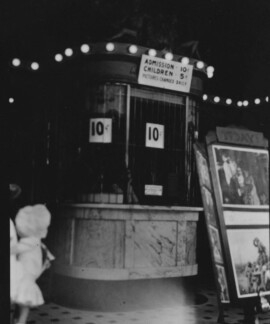
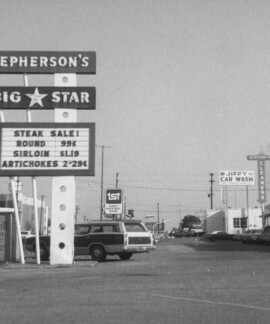
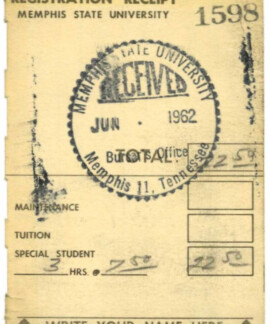
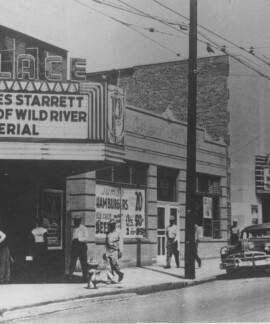
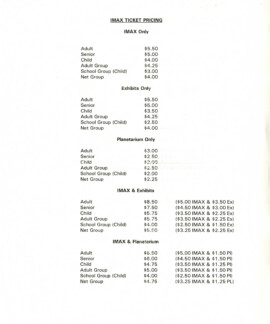
To learn more about pricing, inflation, and the value of a dollar, click the photo on the right to browse the Consumer Prices Gallery. The gallery highlights prices in Memphis throughout the years by showcasing photographs, advertisements, and receipts.
Also, be sure to check out the Pete & Sam's menus below. Use the slider to compare the 1958 menu to the 2000s menu. How much has the price of an 8oz filet changed in 50 years?
Menus: Pete & Sam's (1958). Restaurant and Menu Collection, DIG MEMPHIS / Pete & Sam's (2000s). Restaurant and Menu Collection, DIG MEMPHIS


